


Auburn Research magazine, Spring / Summer 2023
stories list


2022 Year-end metrics
Research Expenditures
This is the information represented in the image below
- Fiscal year 2017: 190.3 million dollars
- Fiscal year 2018: 212.9 million dollars
- Fiscal year 2019: 231.6 million dollars
- Fiscal year 2020: 255.3 million dollars
- Fiscal year 2021: 266.4 million dollars
- Fiscal year 2022: 304.4 million dollars
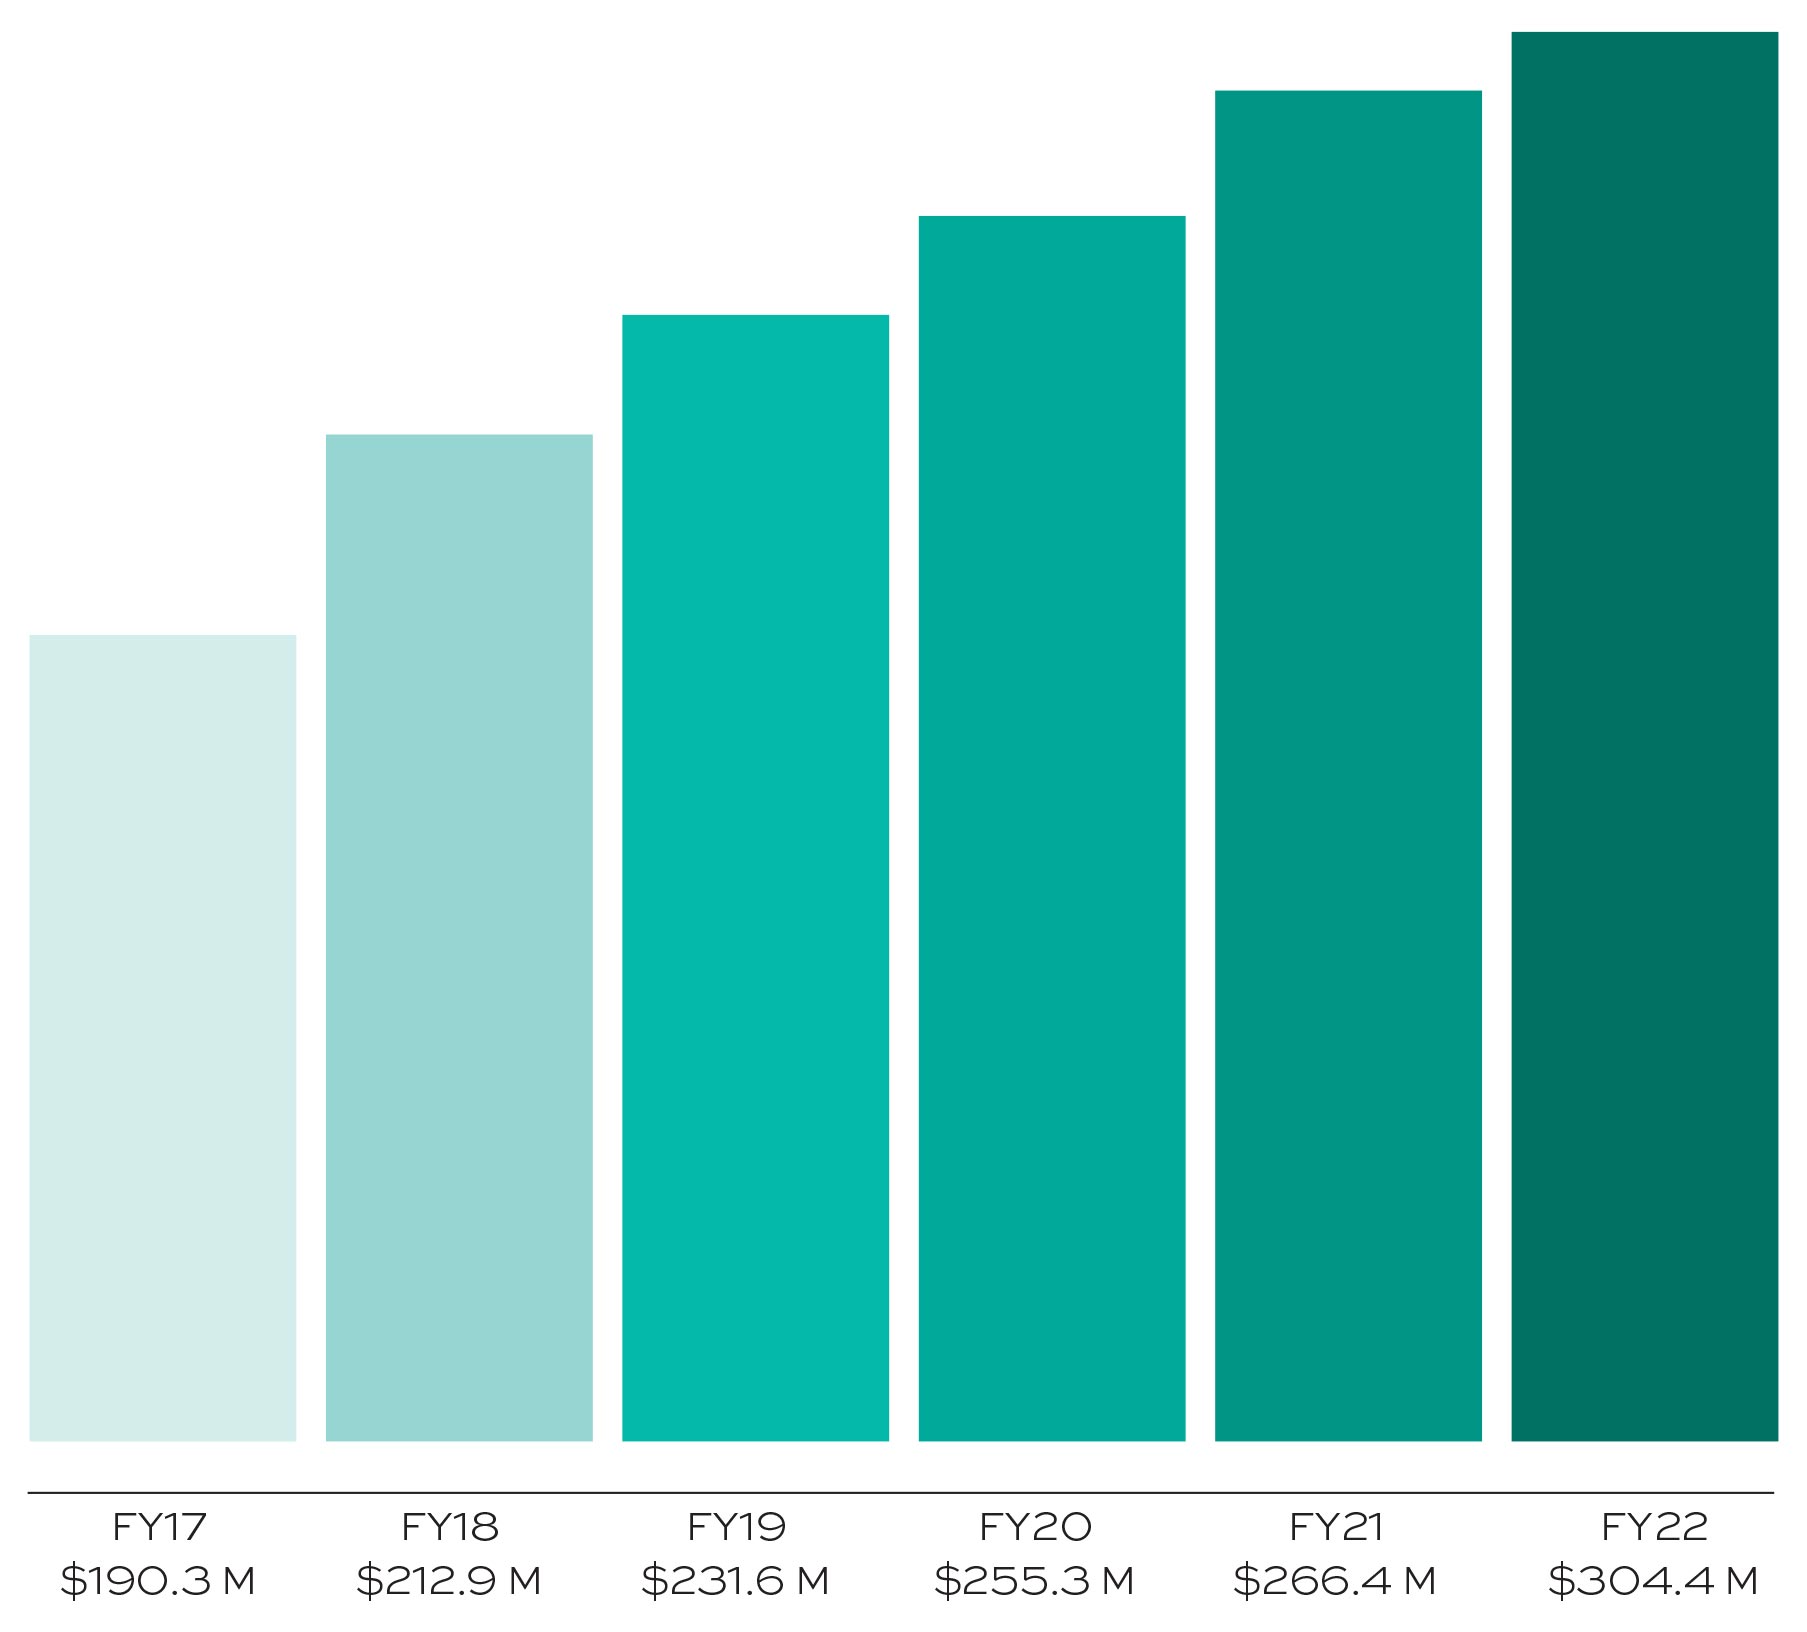
Research expenditures* have increased approximately 60% since FY2017.
*as reported in the NSF HERD Survey
Commercialization Metrics
48
Invention Disclosures
17
Standard U.S. Patent Applications Filed
65
Provisional U.S. Patent Applications Filed
8
Other U.S. Patent Applications Filed
22
U.S. Patents
23
Licenses / Options Executed
3
Startup Companies Formed
$2,189,203
Option and License Income